

Kibana is basically the visualisation tool of Elasticsearch. In this blog you can find the installation procees of all the parts of ELK – Elasticsearch, Logstash, Kibana. If you havn’t yet installed Elasticsearch and logsatsh feel free to click: How to install and configure Elasticsearch
How to install and configure Logstash
So first, let’s brifely go over the purpose of Kibana in the ELK stack
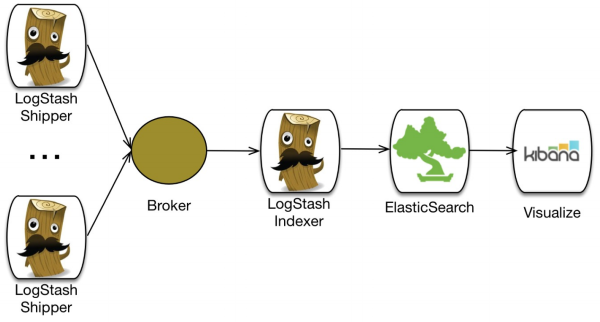
This picture is very helpfull to understanding what is the purposes of Kibana.
1. The data of the logs is being collected by Logsatsh
2. Elasticsearch stores the data and allows full text search, structured search, performing analytics etc.
3.Visualise data – in a browser-based analytics and search dashboard
Step 1: Installation
The first step is getting the installation from the official website:
[root@kibana ~] wget https://download.elasticsearch.org/kibana/kibana/kibana-4.0.1-linux-x64.tar.gz
Next, extract the file:
[root@kibana ~] tar xzf kibana-4.0.1-linux-x64.tar.gz
Step 2: Configuration
Next let’s go into the Kibana directory:
[root@kibana ~] cd kibana-4.0.1-linux-x64
Open the yml configuration file:
[root@kibana ~] vi config/kibana.yml
Now the only thing we need to configure in here is the URL of Elasticsearch.
Find the line elasticsearch_url and append your url:
elasticsearch_url: "ELASTICSEARCH_URL_HERE"
Step 3: Finishing up
Now, le’ts run Kibana by using the following command:
[root@kibana ~] nohup ./bin/kibana &
Note:
* Make sure that port 5601 is open in your security group!
The last step: openning your kibana. nevigate to the page:
http://KIBANA_URL:5601/
And that’s it.. you have a full ELK stack.

Pingback: How to install and configure Logstash in AWS